

Reports
The nine reports, what each one answers, how the date range and the grouping work, why the Excel file arrives a moment later, and what a branch does to the figures.
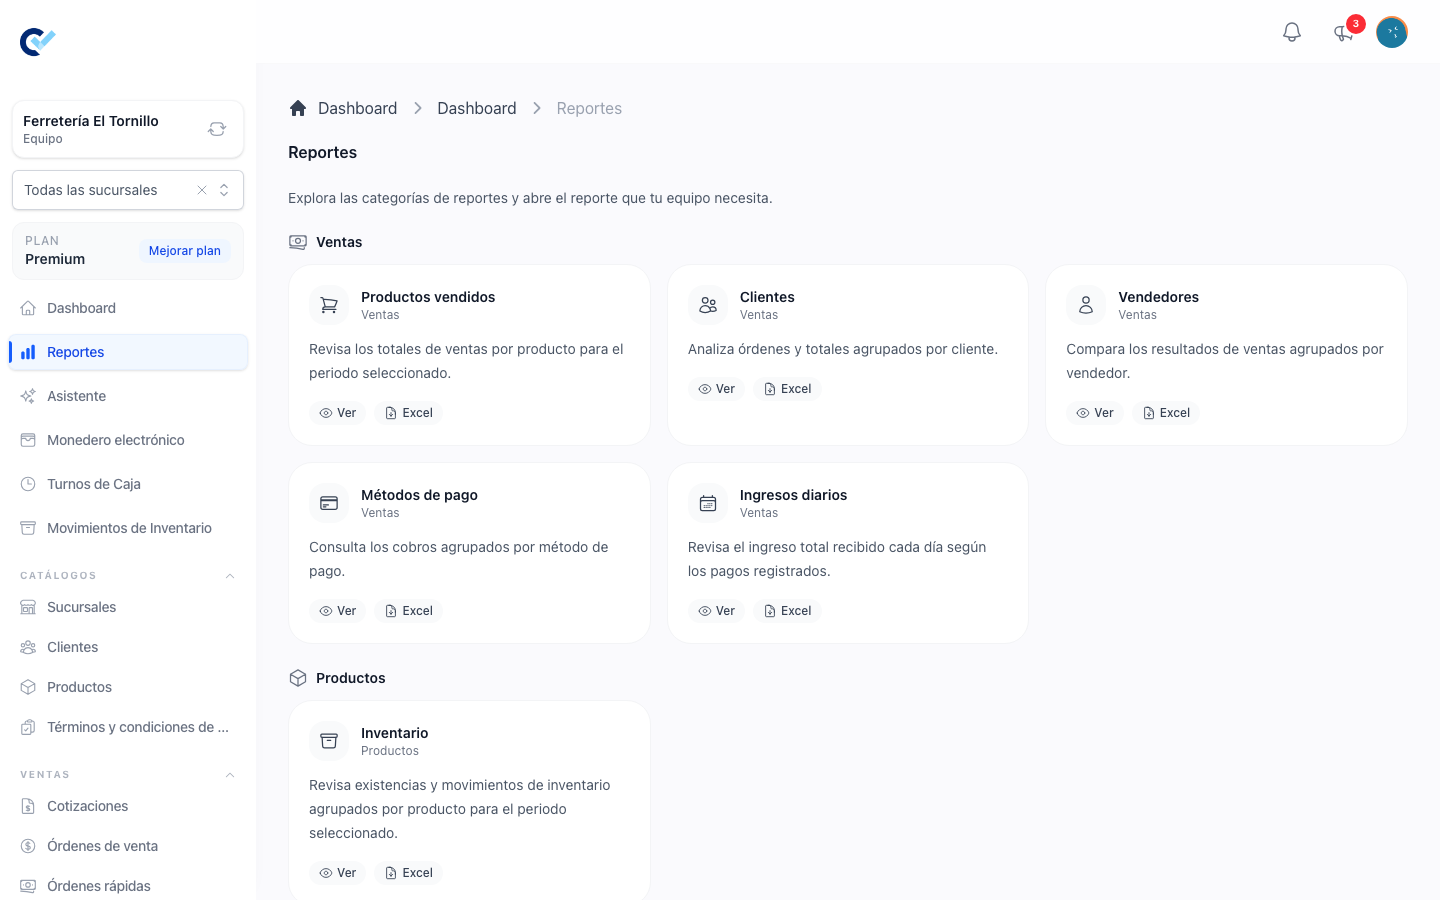
Reports sits at the top of the menu, under the dashboard. It is a list of report categories; you open one report at a time, give it a period, and read it.
Every report is read-only. Nothing on these screens changes a document — they are the same records you already have, counted a different way.
The nine reports
Sales
| Report | What it answers |
|---|---|
| Products sold | What sold in the period, by product: units, how many orders it appeared on, and the total. |
| Clients | Which clients bought, how many orders each one placed, and how much they spent. |
| Sellers | The same, by whoever made the sale. |
| Payment Methods | What was collected, split by how it was paid. |
| Daily Income | What came in each day, from the payments registered. |
Products
| Report | What it answers |
|---|---|
| Inventory | By product, the stock at the start of the period, what came in and went out during it, and the stock at its close. Needs inventory in your plan. |
Purchases
| Report | What it answers |
|---|---|
| Purchased Products | Units bought, on how many orders, and what they cost. |
| Suppliers | What was paid to each supplier, and what was refunded. |
Both need purchase orders in your plan.
Finances
| Report | What it answers |
|---|---|
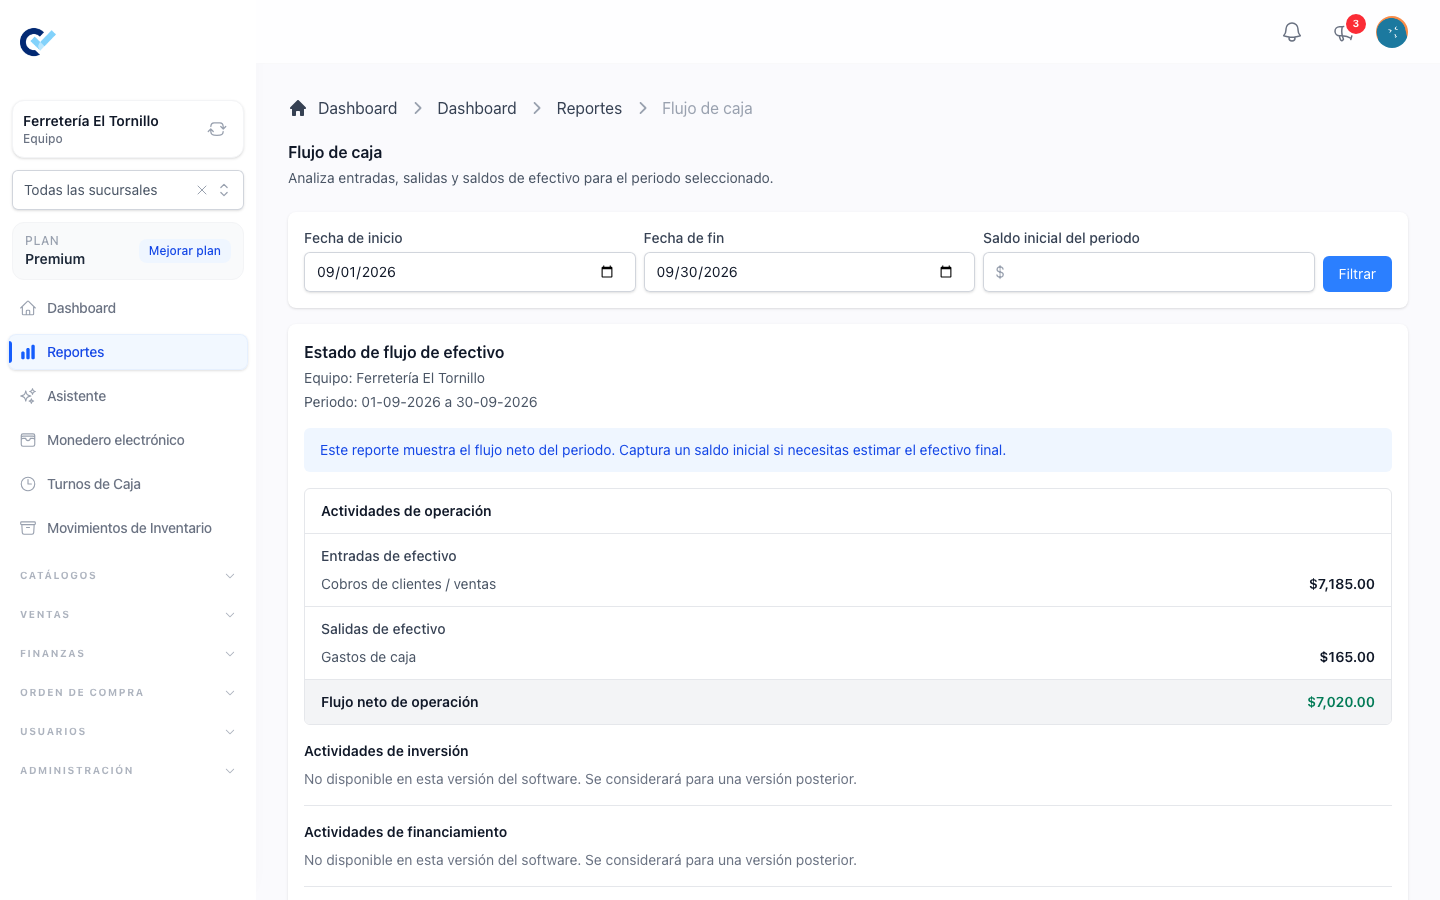
| Cash Flow | Money in against money out over the period, with the balance between them. |
The period
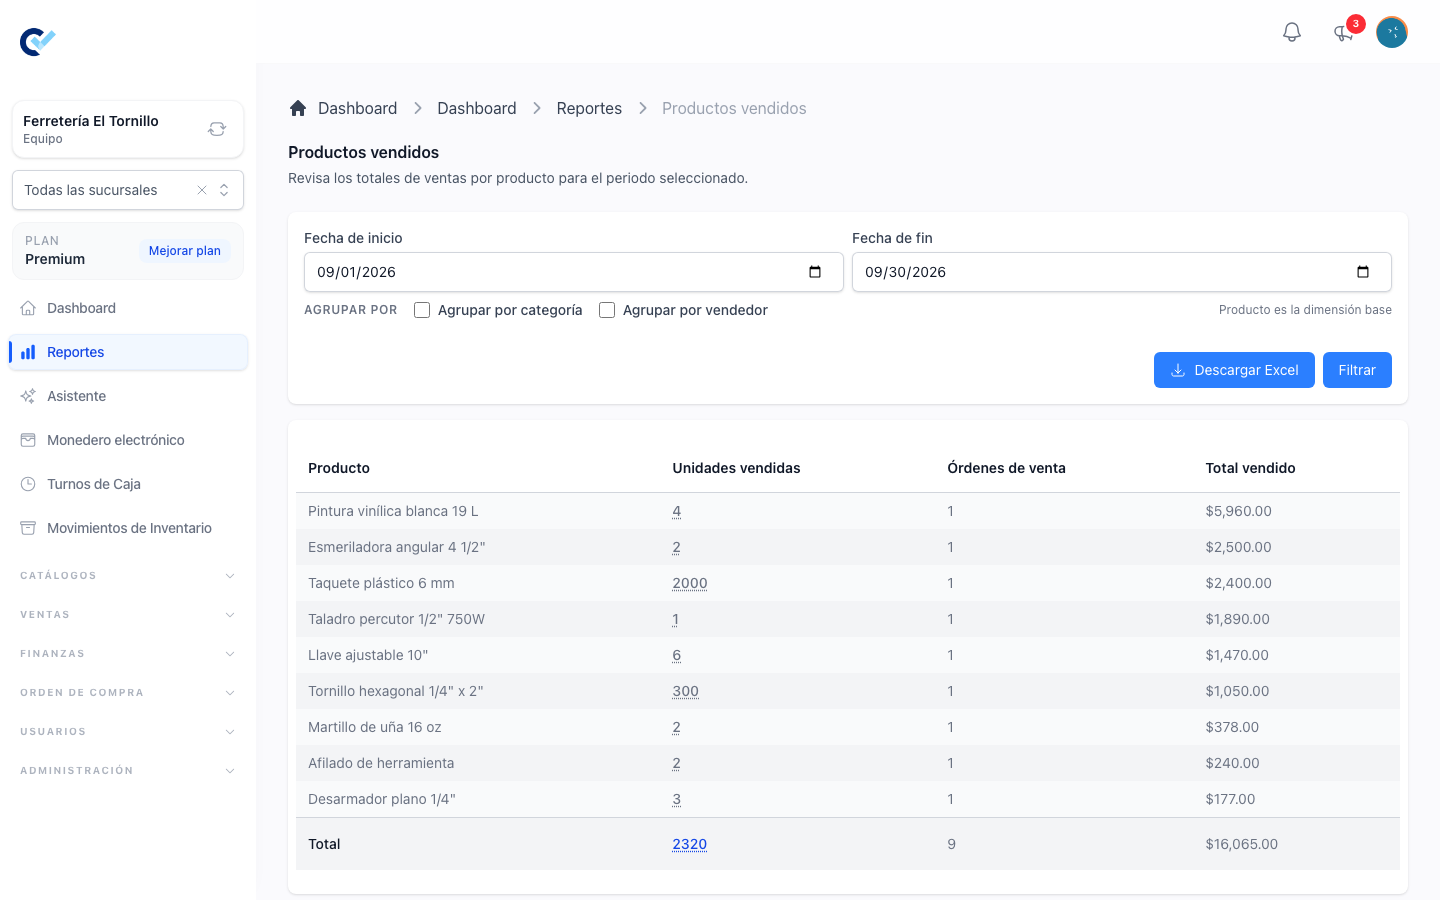
Every report opens on the current month and asks for two dates: Start date and End date. The end cannot be before the start, and Filter applies them.
The dates travel in the address bar, so reloading gives the same report back and the link opens it for whoever you send it to.
The reports do not all read that period the same way, and it is worth knowing which is which:
- Daily Income, Payment Methods, Suppliers and Cash Flow count money that moved — they read payments, so a sale made in March and paid in April counts in April.
- Products sold, Clients, Sellers and Purchased Products count documents — they read finished orders, so that same sale counts in March.
Neither is wrong. They answer different questions, and comparing the two without noticing is where an hour goes.
Grouping
Three of the sales reports can be broken down further, with Group by above the table:
| Report | Can also group by |
|---|---|
| Products sold | Category, seller |
| Clients | Product, seller |
| Sellers | Product |
The report's own dimension stays the outer group — a clients report grouped by product is still a list of clients, opened into what each of them bought. Picking several drags them into the order you want, and the order is what the table nests by.
Inventory
The inventory report has one row per product, with four figures for the period:
- Initial — the stock the product had when the period started.
- Entries — everything that came in between the two dates, both days included.
- Exits — everything that went out over the same days.
- Final — Initial plus Entries minus Exits: the stock at the close of the period.
Final is the stock on the end date, not the stock you have today. For a period that ended last month, today's stock also carries everything that moved since, so the two can differ without anything having gone missing. The total at the foot of the table and the Excel file show the same Final.
A product appears when any of its four figures is not zero. Show all products also lists the physical products that had nothing in the period, at zero. A product with variants stays one row, with its variants added together. Search and Category narrow the list, and the branch decides which movements count.
Cash flow
Cash flow has one extra field, Initial balance of the period. Fill it in and the report adds an opening and a closing balance to the movements; leave it empty and it shows the movements and the net between them, without pretending to know what you started with.
What counts as money in is the payments collected. What counts as money out is the expenses registered against cashier shifts and the refunds paid back. Both sides are broken down by payment method.
Excel
Every report except cash flow can leave as an Excel file. Download Excel does not hand you a file on the spot: the file is built on the server, and a window lists the exports of that report with their period, who asked for them and their status. You can close it and come back — the file waits, and Download takes it when it is ready.
That is deliberate. A report over a long period with a deep grouping is not something a browser should be made to sit through.
Branches
Inside a branch, every report is that branch's. On All Branches they are the whole business. The report you export carries the branch you were standing in when you asked for it, which is worth checking before sending a figure to somebody.
Who sees what
Two things decide it, and a third deliberately does not.
Your plan decides which reports are on the list. A report over a module you do not have is not offered at all — inventory, purchased products and suppliers are the three.
Your branch decides the figures, as above.
Your role does not narrow them. Reports carry no permission of their own: anybody who can open the menu entry reads them, and the figures are the whole team's — or the whole branch's — whatever that person is allowed to see elsewhere. A salesperson restricted to their own sell orders still reads everyone's totals here.
That is worth knowing before you hand out the menu. See who can do what.
A report that shows nothing is usually the branch rather than a period with no sales in it — check the selector first.